Table of Contents
Cloud Config File Downloads
Introduction
Welcome to the DevOps Library! This is Samantha, and in this episode, we're going to cover Cloudbees Jenkins Analytics or CJA for short. While it may not be necessary for smaller environments, Jenkins analytics is awesome once you start trying to scale. It'll help you answer questions such as "Why is my Jenkins master running slowly?" or "How fast are our jobs running?". It's also pretty easy to configure.
Getting Started
Alright, let's go ahead and get started! First, we're going to need to set up a Jenkins Operations Center. If you've been following along, you should already be good to go, but if not, don't worry! Just watch our last episode here, or you can sign up for a trial at Cloudbees.com.
Once that's setup, go to "Manage Jenkins," followed by "Configure Analytics." On this page, we need to tell Jenkins where to store our analytics data. While you do have the option of using an embedded form of Elasticsearch, it doesn't work that well, even for test instances. Because of that, we're going to set up a remote elastic search instance. First, spin up a new Ubuntu 14.04 server. Once it comes up, install Java JDK 8 by running the following commands.
add-apt-repository ppa:webupd8team/java -y
echo 'debconf shared/accepted-oracle-license-v1-1 select true' | debconf-set-selections
echo 'debconf shared/accepted-oracle-license-v1-1 seen true' | debconf-set-selections
apt-get update
apt-get install oracle-java8-installer -y
Next, let's install ElasticSearch. Run the following commands to install version 1.7.4.
wget https://download.elastic.co/elasticsearch/elasticsearch/elasticsearch-1.7.4.deb
dpkg -i elasticsearch-1.7.4.deb
echo 'network.host: 0.0.0.0' > /etc/elasticsearch/elasticsearch.yml
service elasticsearch start
While you can use a newer version of Elasticsearch, 1.7.4 is the version that Cloudbees recommends, and we did run into issues on some of the newer releases. Lastly, once Elasticsearch finishes installing, we need to allow remote connections to Elasticsearch. Open up /etc/elasticsearch/elasticsearch.yml.
Add 'network.host: 0.0.0.0', then save and close the file. Now run
service elasticsearch startThen switch back to our Jenkins Operations server.
Click the "Elasticsearch Configuration** dropdown, and select "Remote Elasticsearch Instance". For the URL, type "http://IpOfElasticSearch:9200". Then click "Test Connection". Perfect, there we go! Now scroll down a bit, and select "Enable" under the "Analytics Reporting Configuration". For the reporting endpoint, paste in the URL to our Jenkins Operations Center, followed by slash feeder, then hit save.
Now we need to enable analytics reporting on our individual masters. On each master, go to "Manage Jenkins", "Configure Analytics", then select "Enable". The reporting endpoint is the same as what we used earlier, the URL to our operations center followed by /feeder. Now hit save. Great job!! We've finally finished setting up Jenkins analytics. Now go ahead and kick off some jobs to generate some data. Once the jobs finish running, switch to the CJOC and click the "Build Analytics" tab.
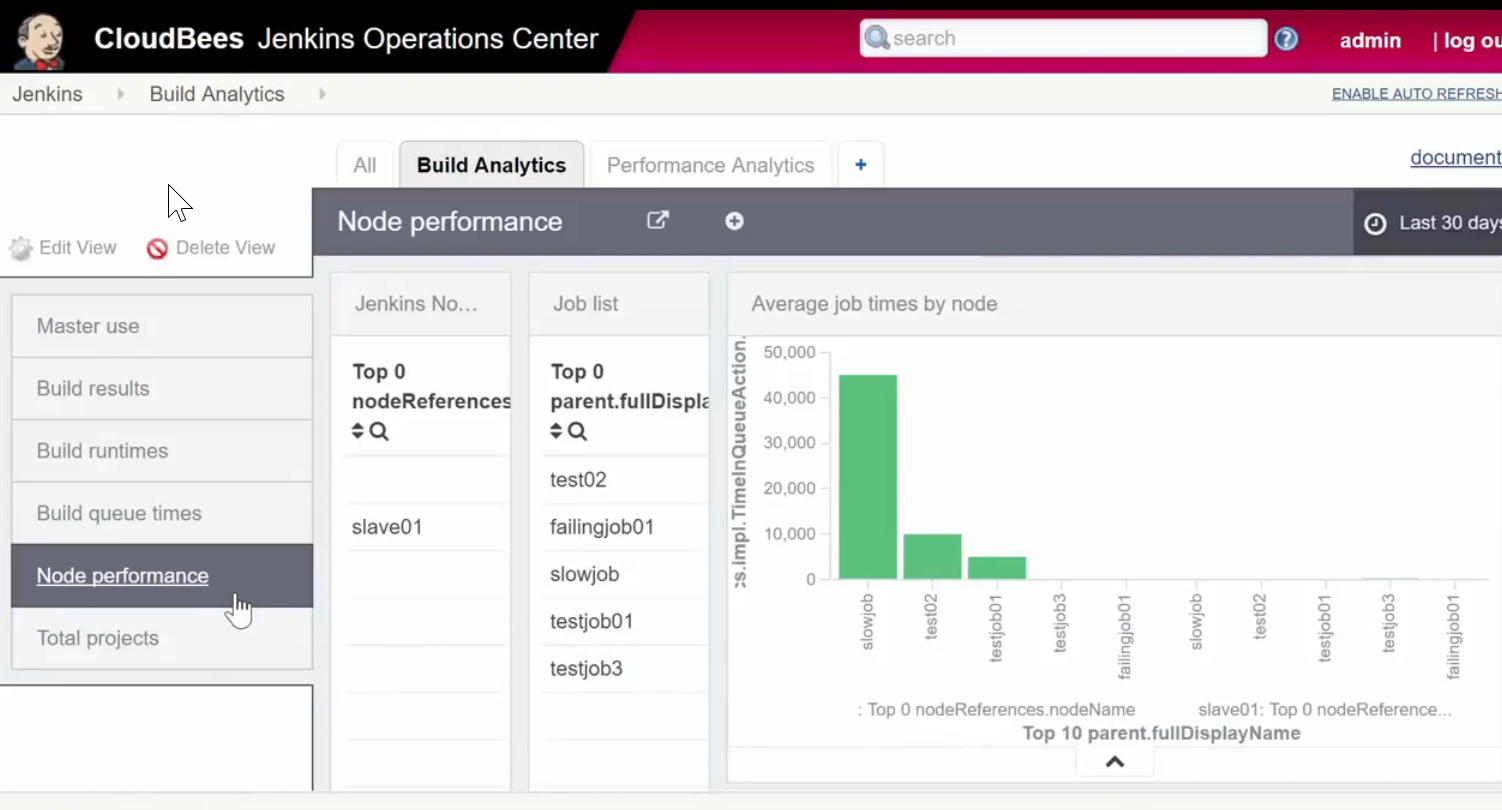
At this point, feel free to wander around and see what information might be useful for your team. Let's go through a few examples to get you started. What if we'd like to know which jobs are taking the longest to run? Click the "Node performance" tab. On the right, we can see that "slowjob" is by far our slowest job, and if we scroll down we can see the average duration of the top 10 longest running jobs. Or maybe someone is complaining about the performance of one of our Jenkins masters. If you go to the "Performance Analytics" tab, we can easily see how much CPU, memory, and executors are in use on each master.
Pretty cool huh? Well, that's it for our lesson on Jenkins Analytics, great job following along. If you'd like to make more advanced dashboards, you can use the Analytics Dashboard creator to make pretty much anything you'd like; it just takes some experience with Kibana.
Thanks again for watching today! If you like our videos, please subscribe to our Youtube channel! If you love them and want to help support us, visit patreon.com/devopslibrary, we’ll even list you on our high scores at the end of each video. Thanks again, see you again soon!